Survey
2001:
Survey
2001:The Results Are In
by Paul Morton
Survey
2001:
The Results Are In
by Paul Morton
The results of the 2001 ATRA member survey are in, and we’ve spent considerable time comparing the numbers to those of previous years. One always hopes that a pattern of significant difference leaps off the paper, but, more often than not, the differences are much more subtle.
We’ve provided many of the more interesting data in direct-comparison tables for you to look at and draw your own conclusions. When viewing results from a survey it’s important to keep in mind that the numbers aren’t absolute. There is always a small statistical deviation that accompanies the data because of different variables. In a practical sense, though, the numbers will accurately portray the direction and extent of change.
I thought it might be interesting to provide a broad, generalized profile of a shop and shop owner, pulled from the collective data from those who responded. Owners are typically male, in their 40’s, with some college education and about 15 years experience in the industry. Typically they own the business – a single shop operation - as a family venture, as well as the property it sits on. The business employs fewer than six people, with the average being around three. The owner works fifty or more hours per week, and intends to stay in the industry. About half of the shops report average weekly gross sales of less than $15,000 per week, with two-thirds indicating a profit margin of between 10% and 20%. Slightly more than 80% reported a come-back rate of five per cent or less on major repairs. Slightly less than 80% attributed those come backs to either parts failure or a workmanship issue.
A large segment (almost 42%) of those reporting, said they were either not getting the price they needed for their work, or weren’t sure if they were.
As I said, it’s a broad, generalized look at a typical owner and shop. Some of the individual answers deserve a closer look, though, and I’ve broken a few of them out for specific comment.
I didn’t have to look far to find the first point of interest. Answers to the first question indicate a decline in the number of respondents who have less than five years involvement in the industry. The number in 1995 (6.6%) was considerably higher than the 2.7% recorded in the latest survey. Does the lower number indicate that fewer people are coming into the industry? If this were not the case, I would expect to see even higher numbers in the 5-10 year range of the latest survey. Since that’s not the case, I think it does indicate fewer new start-ups.
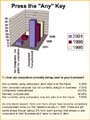
Not too surprising is the change in the number of shops that described their operation as being "completely computerized." In 1995, the number stood at 27.9%; in 2001, the number increased to 42.48%. As technically oriented as the industry has become, the increase seems to be a logical progression. As more shops realize the business-related value in computerization – generation of work orders, inventory control, customer data base, accounting, on-line connection access for technical information, etc., I would expect that number to increase even more in the future.
|
|
|
|
|
Click an image to see a full size survey result. |
||
|
|
|
Prior to this survey, indications of what role shop owners played in daily operation were pretty consistent: about half wore the hats of owner, manager, and technician. This increased to over 63% by 2001. If I had to draw any inference from this, it would be that today’s business climate demands greater direct involvement from the owner.
Of those businesses who operate multiple shops, nearly 73% reported having two or three locations; up 14% from the 1998 survey, and a surprising 50% increase over 1995. More than half of those businesses (53.33%), have reported using a centralized rebuilding operation to support their effort – a 10% increase over the last survey.
Data I found to be very interesting centered on the question of use of remanufactured transmissions. Not for what it said or explained, but for what it didn’t clarify. In 1995, 80% of the respondents said they used remans 10% of the time or less. By 1998 that figure stood at over 87%. The current figure places the usage at nearly 92%. The other ranges in this particular question showed similar distribution. The logical conclusion is that over the years, fewer shops are using remans.
I thought this was particularly interesting in light of the information I learned not long ago from some of the remanufacturers themselves, and conveyed in an article on the topic. Across the board, they reported a significant increase in the sales of remans - to both general repair shops and transmission specialty shops. An interesting disparity, but not one from which the real meaning can be easily understood.
According to 41.51% of the respondents, the average hourly rate shop owners paid their rebuilders is in the $20 to $30 per hour range. This rep-resents an increase in 10% over the ’98 survey, and 30% over the ’95 survey. In the current survey, 76.63% said they paid their R&R Technicians in the $10 to $20 range. In 1998 the response indicated 70.09%, and in 1995, it was 41.0%. Similar increases over the past six years for both specialties, with both out-stripping the rate of inflation over that same time period.
I found the results to the question, "Do you feel you are getting the price you need for the work you do?" to be very interesting. The results for all three surveys were very consistent (with the exception on the ’98 survey, which apparently dropped the "not sure" response category. If those who would have responded in this category – based on other years – included their unsure feeling in the "no" response instead, the results are remarkably consistent).
What I find most interesting in these responses is that nearly a third of all respondents, over the years, aren’t getting the price they need. Not would like to get, but need.
On average, about 10% of those who said they are not getting their price indicate it’s because of a lack of good sales skills. Another potential answer to this question, that of "economic conditions," nearly doubled from the ’95 survey to those in ’98 and ’01. "Economic conditions" can include a lot of variables, and mean different things to different people. I would have to think, though, that good sales skills could overcome at least a number of those factors. I think the real issue here is that only about 10% of the respondents realize they have a problem with their sales skills, and the real number is probably higher. If those skills could be improved, I’d be willing to bet that the "economic conditions" in their market area would improve.
Though I could go on comparing numbers and attaching my interpretation to them, I think it’s more important that you apply your own. As I said at the beginning of this piece, the numbers are not absolute. They may be affected by variables we can’t yet see or understand. I do think the survey is capable of indicating trends, and is an excellent tool for comparing your own operation against the represented average of others.
Take some time and sift through the survey results. If you see something we haven’t, or you just want to comment, please give us a call, or send off an e-mail. I can be reached at pmorton38@hotmail.com. You can reach Rodger Bland at Rodger@atra-gears.com. For complete survey results, click here, or turn to page 60 of the Jan/Feb 2002 issue of GEARS.